CAT 2019 DI and Reasoning - slot 02
Directions for Question 01 to 04:
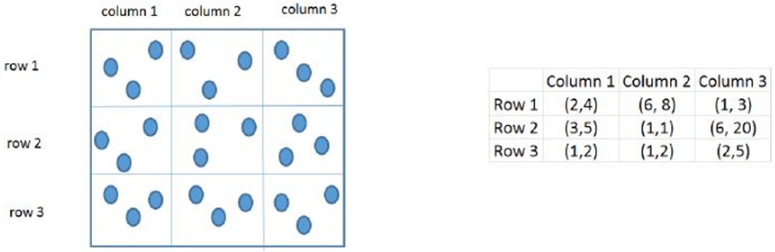
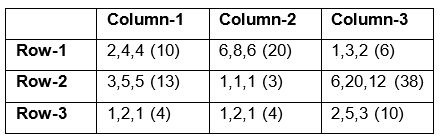
Three pouches (each represented by a filled circle) are kept in each of the nine slots in a 3 × 3 grid, as shown in the figure. Every pouch has a certain number of one-rupee coins. The minimum and maximum amounts of money (in rupees) among the three pouches
in each of the nine slots are given in the table. For example, we know that among the three pouches kept in the second column of the first row, the minimum amount in a pouch is Rs. 6 and the maximum amount is Rs. 8.
There are nine pouches in any of the three columns, as well as in any of the three rows. It is known that the average amount of money (in rupees) kept in the nine pouches in any column or in any row is an integer. It is also known that the total amount of money kept in the three pouches in the first column of the third row is Rs. 4.
What is the total amount of money (in rupees) in the three pouches kept in the first column of the second row?
Question 02: How many pouches contain exactly one coin?
Question 03: What is the number of slots for which the average amount (in rupees) of its three pouches is an integer?
Question 04: The number of slots for which the total amount in its three pouches strictly exceeds Rs. 10 is
Question 05: Directions for questions 5 to 8:
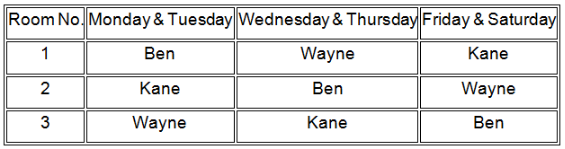
Three doctors, Dr. Ben, Dr. Kane and Dr. Wayne visit a particular clinic Monday to Saturday to see patients. Dr. Ben sees each patient for 10 minutes and charges Rs. 100/-. Dr. Kane sees each patient for 15 minutes and charges Rs. 200/-, while Dr. Wayne sees each patient for 25 minutes and charges Rs. 300/-.
The clinic has three rooms numbered 1, 2 and 3 which are assigned to the three doctors as per the following table.
The clinic is open from 9 a.m. to 11.30 a.m. every Monday to Saturday.
On arrival each patient is handed a numbered token indicating their position in the queue, starting with token number 1 every day. As soon as any doctor becomes free, the next patient in the queue enters that emptied room for consultation. If at any time,
more than one room is free then the waiting patient enters the room with the smallest number. For example, if the next two patients in the queue have token numbers 7 and 8 and if rooms numbered 1 and 3 are free, then patient with token number 7 enters
room number 1 and patient with token number 8 enters room number 3.
What is the maximum number of patients that the clinic can cater to on any single day?
a. 31
b. 12
c. 15
d. 30
Question 06: The queue is never empty on one particular Saturday. Which of the three doctors would earn the maximum amount in consultation charges on that day?
a. Dr. Kane
b. Dr. Wayne
c. Both Dr. Wayne and Dr. Kane
d. Dr. Ben
Question 07: Mr. Singh visited the clinic on Monday, Wednesday, and Friday of a particular week, arriving at 8:50 a.m. on each of the three days. His token number was 13 on all three days. On which day was he at the clinic for the maximum duration?
a. Monday
b. Friday
c. Same duration on all three days
d. Wednesday
Now if we send patients as per the rules given in the question, then Mr. Singh, who has token number 13, will visit Dr. Wayne in room number-3 (50-75) on Monday, Dr. Ben in room number-2 (50-60) on Wednesday and Dr. Ben in room number-3 (50-60) on Friday. Hence On Monday he was at the clinic for the maximum duration.
Question 08: On a slow Thursday, only two patients are waiting at 9 a.m. After that two patients keep arriving at exact 15 minute intervals starting at 9:15 a.m. -- i.e. at 9:15 a.m., 9:30 a.m., 9:45 a.m. etc. Then the total duration in minutes when all three doctors are simultaneously free is
a. 0
b. 10
c. 15
d. 30
If we send these patients as per the rule than there is fixed pattern that Dr. Wayne is free for 5 minutes after every 25 minutes, Dr. Ben is free for 10 minutes after every 10 minutes and Dr. Kane is engaged for 15 minutes after every 15 minutes. Hence there is no time when all three doctors are simultaneously free
Question 09: Directions for questions 9 to 12:
The first year students in a business school are split into six sections. In 2019 the Business Statistics course was taught in these six sections by Annie, Beti, Chetan, Dave, Esha, and Fakir. All six sections had a common midterm (MT) and a common
endterm (ET) worth 100 marks each. ET contained more questions than MT. Questions for MT and ET were prepared collectively by the six faculty members. Considering MT and ET together, each faculty member prepared the same number of questions.
Each of MT and ET had at least four questions that were worth 5 marks, at least three questions that were worth 10 marks, and at least two questions that were worth 15 marks. In both MT and ET, all the 5-mark questions preceded the 10-mark questions,
and all the 15-mark questions followed the 10-mark questions.
The following additional facts are known.
i. Annie prepared the fifth question for both MT and ET. For MT, this question carried 5 marks.
ii. Annie prepared one question for MT. Every other faculty member prepared more than one questions for MT.
iii. All questions prepared
by a faculty member appeared consecutively in MT as well as ET.
iv. Chetan prepared the third question in both MT and ET; and Esha prepared the eighth question in both.
v. Fakir prepared the first question of MT and the last one
in ET. Dave prepared the last question of MT and the first one in ET.
The second question in ET was prepared by:
a. Dave
b. Beti
c. Esha
d. Chetan
Each of MT and ET had at least four questions that were worth 5 marks, at least three questions that were worth 10 marks, and at least two questions that were worth 15 marks. So total 9 questions of (20 + 30 + 30) 80 marks are fixed in both ET and MT. Now there are many options for remaining 20 marks questions like 4 questions of 5 marks, 2 questions of 5 marks and 1 question of 10 marks, 2 questions of 10 marks, 1 question of 5 marks and 1 question of 15 marks. So the total number of questions can be 13, 12 or 11.
MT cannot have total 13 number of questions because ET has more number of questions than MT. So MT will have either 12 or 11 total number of questions. Similarly ET will have either 13 or 12 number of total questions. Now total number of questions MT and ET together should be multiple of 6 and also ET has more number of questions than MT so ET has total 13 questions and MT has 11 total number of questions.
So MT would have either 5, 5, 5, 5, 10, 10, 10, 10, 10, 15, 15 or 5, 5, 5, 5, 5, 10, 10, 10, 15, 15, 15. But Annie did the 5th question in MT of 5 marks so the first combination would not work.
Now we can make a table and fill the name of faculty members as per the given conditions.
The second question in ET was prepared by Dave.
Question 10: How many 5‐mark questions were there in MT and ET combined?
a. 13
b. 10
c. 12
d. Cannot be determined
Question 11: Who prepared 15-mark questions for MT and ET?
a. Only Dave, Esha and Fakir
b. Only Beti, Dave, Esha and Fakir
c. Only Dave and Fakir
d. Only Esha and Fakir
Question 12: Which of the following questions did Beti prepare in ET?
a. Tenth question
b. Seventh question
c. Ninth question
d. Fourth question
Question 13: Directions for questions 13 to 16:
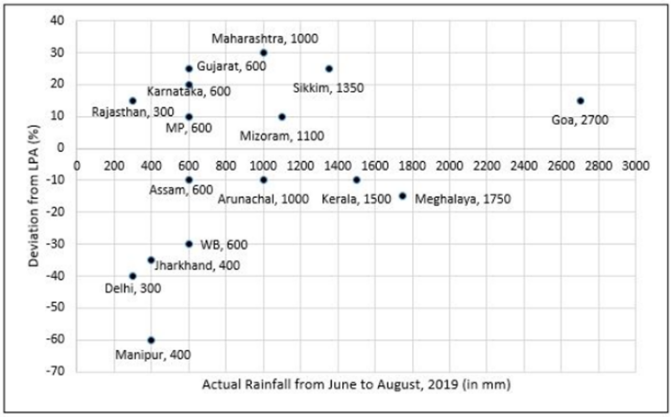
To compare the rainfall data, India Meteorological Department (IMD) calculated the Long Period Average (LPA) of rainfall during period June-August for each of the 16 states. The figure given below shows the actual rainfall (measured in mm) during
June-August, 2019 and the percentage deviations from LPA of respective states in 2018. Each state along with its actual rainfall is presented in the figure.
If a ‘Heavy Monsoon State’ is defined as a state with actual rainfall from June-August, 2019 of 900 mm or more, then approximately what percentage of ‘Heavy Monsoon States’ have a negative deviation from respective LPAs in 2019?
a. 42.86
b. 75.00
c. 57.14
d. 14.29
A ‘Heavy Monsoon State’ is defined as a state with actual rainfall from June-August, 2019 of 900 mm or more. So the seven Heavy Monsoon States are Maharashtra, Arunachal, Mizoram, Sikkim, Kerala, Meghalaya and Goa. Out of which three states has negative deviation from LPA. So the answer is \(\frac{3}{7} \times 100 = 42.86\% \).
Question 14: If a ‘Low Monsoon State’ is defined as a state with actual rainfall from June-August, 2019 of 750 mm or less, then what is the median ‘deviation from LPA’ (as defined in the Y-axis of the figure) of ‘Low Monsoon States’?
a. -10%
b. -20%
c. 10%
d. -30%
Question 16: The LPA of a state for a year is defined as the average rainfall in the preceding 10 years considering the period of June-August. For example, LPA in 2018 is the average rainfall during 2009-2018 and LPA in 2019 is the average rainfall during 2010-2019. It is also observed that the actual rainfall in Gujarat in 2019 is 20% more than the rainfall in 2009. The LPA of Gujarat in 2019 is closest to
a. 490 mm
b. 475 mm
c. 505 mm
d. 525 mm
It is also given that the actual rainfall in Gujarat in 2019 is 20% more than the rainfall in 2009. So the rainfall in Gujarat in 2009 was 500 mm.
The Total rainfall in Gujarat from 2009 to 2018 was 480 × 10 = 4800 and the Total rainfall in Gujarat from 2010 to 2019 is 4800 – 500 + 600 = 4900. Hence the LPA in 2019 is 490.
Question 17: Directions for questions 17 to 20:
In the table below the check marks indicate all languages spoken by five people: Paula, Quentin, Robert, Sally and Terence. For example, Paula speaks only Chinese and English.
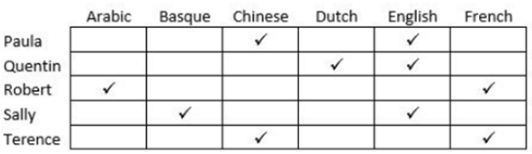
These five people form three teams, Team 1, Team 2 and Team 3. Each team has either 2 or 3 members. A team is said to speak a particular language if at least one of its members speak that language.
The following facts are known.
(1) Each team speaks exactly four languages and has the same number of members.
(2) English and Chinese are spoken by all three teams, Basque and French by exactly two teams and the other languages by exactly one team.
(3) None of the teams
include both Quentin and Robert.
(4) Paula and Sally are together in exactly two teams.
(5) Robert is in Team 1 and Quentin is in Team 3.
Who among the following four is not a member of Team 2?
a. Quentin
b. Sally
c. Paula
d. Terence
Question 18: Who among the following four people is a part of exactly two teams?
a. Quentin
b. Sally
c. Paula
d. Terence
Question 19: Who among the five people is a member of all teams?
No one
Sally
Paula
Terence
Question 20: Apart from Chinese and English, which languages are spoken by Team 1?
a. Basque and French
b. Basque and Dutch
c. Arabic and French
d. Arabic and Basque
Question 21: Directions for questions 21 to 24:
Ten players, as listed in the table below, participated in a rifle shooting competition comprising of 10 rounds. Each round had 6 participants. Players numbered 1 through 6 participated in Round 1, players 2 through 7 in Round 2,..., players 5 through
10 in Round 5, players 6 through 10 and 1 in Round 6, players 7 through 10, 1 and 2 in Round 7 and so on.
The top three performances in each round were awarded 7, 3 and 1 points respectively. There were no ties in any of the 10 rounds. The table below gives the total number of points obtained by the 10 players after Round 6 and Round 10.
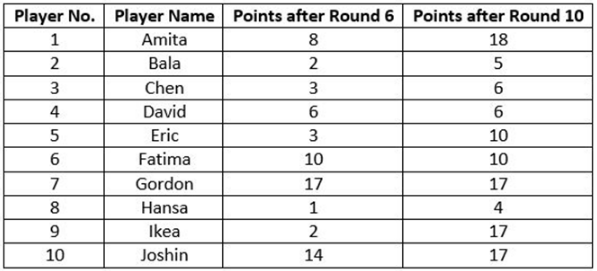
The following information is known about Rounds 1 through 6:
1. Gordon did not score consecutively in any two rounds.
2. Eric and Fatima both scored in a round.
The following information is known about Rounds 7 through 10:
1. Only two players scored in three consecutive rounds. One of them was Chen. No other player scored in any two consecutive rounds.
2. Joshin scored in Round 7, while Amita scored in Round 10.
3. No player scored in all the four rounds.
What were the scores of Chen, David, and Eric respectively after Round 3?
b. 3, 0, 3
c. 3, 3, 0
d. 3, 6, 3
Question 22: Which three players were in the last three positions after Round 4?
b. Bala, Chen, Gordon
c. Bala, Ikea, Joshin
d. Bala, Hansa, Ikea
Question 23: Which player scored points in maximum number of rounds?
b. Joshin
c. Chen
d. Amita
Question 24: Which players scored points in the last round?
b. Amita, Bala, Chen
c. Amita, Chen, David
d. Amita, Eric, Joshin
Question 25: Directions for questions 25 to 28:
A large store has only three departments, Clothing, Produce, and Electronics. The following figure shows the percentages of revenue and cost from the three departments for the years 2016, 2017 and 2018. The dotted lines depict percentage levels. So for example, in 2016, 50% of store's revenue came from its Electronics department while 40% of its costs were incurred in the Produce department.
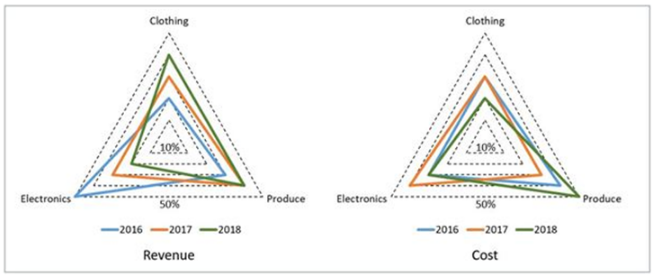
In this setup, Profit is computed as (Revenue – Cost) and Percentage Profit as Profit/Cost × 100%.
It is known that
1. The percentage profit for the store in 2016 was 100%.
2. The store’s revenue doubled from 2016 to 2017, and its cost doubled from 2016 to 2018.
3. There was no profit from the Electronics department in 2017.
4. In 2018, the revenue from
the Clothing department was the same as the cost incurred in the Produce department.
What was the percentage profit of the store in 2018?
Question 26: What was the ratio of revenue generated from the Produce department in 2017 to that in 2018?
b. 16 : 9
c. 4 : 3
d. 9 : 16
Question 27: What percentage of the total profits for the store in 2016 was from the Electronics department?
Question 28: What was the approximate difference in profit percentages of the store in 2017 and 2018?
b. 33.3
c. 25.0
d. 15.5
Question 29: Directions for questions 29 to 32:
Students in a college are discussing two proposals --
A: a proposal by the authorities to introduce dress code on campus, and
B: a proposal by the students to allow multinational food franchises to set up outlets on college campus.
A student does not necessarily support either of the two proposals.
In an upcoming election for student union president, there are two candidates in fray: Sunita and Ragini. Every student prefers one of the two candidates.
A survey was conducted among the students by picking a sample of 500 students. The following information was noted from this survey.
1. 250 students supported proposal A and 250 students supported proposal B.
2. Among the 200 students who preferred Sunita as student union president, 80% supported proposal A.
3. Among those who preferred Ragini, 30% supported
proposal A.
4. 20% of those who supported proposal B preferred Sunita.
5. 40% of those who did not support proposal B preferred Ragini.
6. Every student who preferred Sunita and supported proposal B also supported proposal A.
7.
Among those who preferred Ragini, 20% did not support any of the proposals.
Among the students surveyed who supported proposal A, what percentage preferred Sunita for student union president?
Question 30: What percentage of the students surveyed who did not support proposal A preferred Ragini as student union president?
Question 31: What percentage of the students surveyed who supported both proposals A and B preferred Sunita as student union president?
b. 25
c. 40
d. 20
Question 32: How many of the students surveyed supported proposal B, did not support proposal A and preferred Ragini as student union president?
a. 150
b. 40
c. 200
d. 210