CAT 2022 LR DI slot 02
CAT 2021 Quantitative Ability Slot 01
(Total questions: 20)
Direction for questions 1 to 5:
A specialty supermarket sells 320 products. Each of these products was either a cosmetic product or a nutrition product. Each of these products was also either a foreign product or a domestic
product. Each of these products had at least one of the two approvals – FDA or EU.
The following facts are also known:
1.There were equal numbers of domestic and foreign products.
2.Half of the domestic products were FDA approved
cosmetic products.
3.None of the foreign products had both the approvals, while 60 domestic products had both the approvals.
4.There were 140 nutrition products, half of them were foreign products.
5.There were 200 FDA approved products.
70 of them were foreign products and 120 of them were cosmetic products.
Question 01: How many foreign products were FDA approved cosmetic products?
Watch the video solution
Question 02: How many cosmetic products did not have FDA approval?
[a] 60
[b] 50
[c] Cannot be determined
[d] 10
Watch the video solution
Question 03: Which among the following options best represents the number of domestic cosmetic products that had both the approvals?
Watch the video solution
Question 04: If 70 cosmetic products did not have EU approval, then how many nutrition products had both the approvals?
[a] At least 20 and at most 70
[b] At least 10 and at most 80
[c] At least 10 and at most 60
[d]
At least 20 and at most 50
Watch the video solution
Question 05: If 50 nutrition products did not have EU approval, then how many domestic cosmetic products did not have EU approval?
[a] 10
[b] 50
[c] 30
[d] 20
Watch the video solution
Direction for questions 6 to 10:
The two plots below show data for four companies code-named A, B, C, and D over three years - 2019, 2020, and 2021.
The first plot shows the revenues and costs incurred by the companies during
these years. For example, in 2021, company C earned Rs.100 crores in revenue and spent Rs.30 crores. The profit of a company is defined as its revenue minus its costs.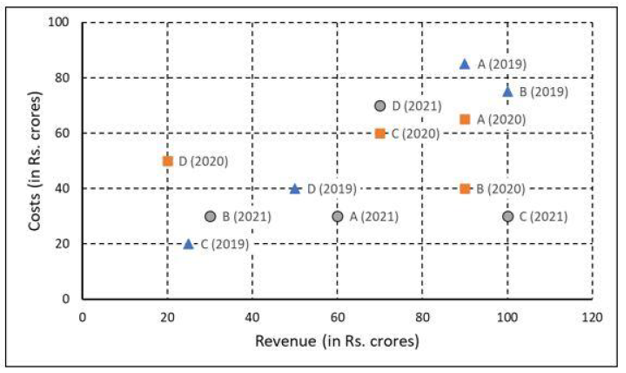
The second plot shows the number of employees employed by the company (employee strength) at the start of each of these three years, as well as the number of new employees hired each year (new
hires). For example, Company B had 250 employees at the start of 2021, and 30 new employees joined the company during the year.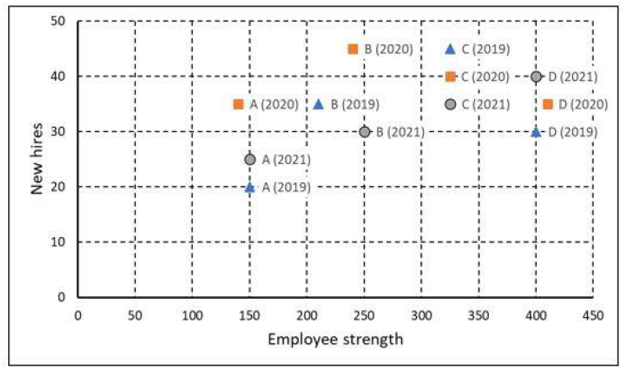
Question 06: Considering all three years, which company had the highest annual profit?
[a] Company B
[b] Company D
[c] Company C
[d] Company A
Watch the video solution
Question 07: Which of the four companies experienced the highest annual loss in any of the years?
[a] Company B
[b] Company C
[c] Company D
[d] Company A
Watch the video solution
Question 08: The ratio of a company's annual profit to its annual costs is a measure of its performance. Which of the four companies had the lowest value of this ratio in 2019?
[a] Company B
[b] Company A
[c] Company
C
[d] Company D
Watch the video solution
Question 09: The total number of employees lost in 2019 and 2020 was the least for:
[a] Company B
[b] Company D
[c] Company C
[d] Company A
Watch the video solution
Question 10: Profit per employee is the ratio of a company's profit to its employee strength. For this purpose, the employee strength in a year is the average of the employee strength at the beginning of that year and the beginning
of the next year. In 2020, which of the four companies had the highest profit per employee?
[a] Company B
[b] Company D
[c] Company A
[d] Company C
Watch the video solution
Direction for questions 11 to 15:
A few salesmen are employed to sell a product called TRICCEK among households in various housing complexes. On each day, a salesman is assigned to visit one housing complex. Once a salesman
enters a housing complex, he can meet any number of households in the time available. However, if a household makes a complaint against the salesman, then he must leave the housing complex immediately and cannot meet any other household on
that day. A household may buy any number of TRICCEK items or may not buy any item. The salesman needs to record the total number of TRICCEK items sold as well as the number of households met in each day. The success rate of a salesman fora
day is defined as the ratio of the number of items sold to the number of households met on that day. Some details about the performances of three salesmen - Tohri, Hokli and Lahur, on two particular days are given below.
1.Over the two
days, all three of them met the same total number of households, and each of them sold a total of 100 items.
2.On both days, Lahur met the same number of households and sold the same number of items.
3.Hokli could not sell any item on
the second day because the first household he met on that day complained against him.
4.Tohri met 30 more households on the second day than on the first day.
5.Tohri’s success rate was twice that of Lahur’s on the first day, and it was
75% of Lahur’s on the second day.
Question 11: What was the total number of households met by Tohri, Hokli and Lahur on the first day?
Watch the video solution
Question 12: How many TRICCEK items were sold by Tohri on the first day?
Watch the video solution
Question 13: How many households did Lahur meet on the second day?
[a] 20 or less
[b] more than 35
[c] between 21 and 29
[d] between 30 and 35
Watch the video solution
Question 14: How many households did Tohri meet on the first day?
[a] more than 40
[b] 10 or less
[c] between 11 and 20
[d] between 21 and 40
Watch the video solution
Question 15: Which of the following statements is FALSE?
[a] Among the three, Lahur had the lowest success rate on the first day.
[b] Among the three, Tohri had the highest success rate on the first day.
[c] Tohri had
a higher success rate on the first day compared to the second day.
[d] Among the three, Tohri had the highest success rate on the second day.
Watch the video solution
Direction for questions 16 to 20:
Every day a widget supplier supplies widgets from the warehouse (W) to four locations –Ahmednagar (A), Bikrampore (B), Chitrachak (C), and Deccan Park (D). The daily demandfor widgets in each
location is uncertain and independent of each other. Demands and corresponding probability values (in parenthesis) are given against each location (A, B, C, and D) in the figure below. For example, there is a 40% chance that the demand in
Ahmednagar will be 50 units and a 60% chance that the demand will be 70 units. The lines in the figure connecting the locations and warehouse represent two-way roads connecting those places with the distances (in km) shown beside the line.
The distances in both the directions along a road are equal. For example, the road from Ahmednagar to Bikrampore and the road from Bikrampore to Ahmednagar are both 6 km long.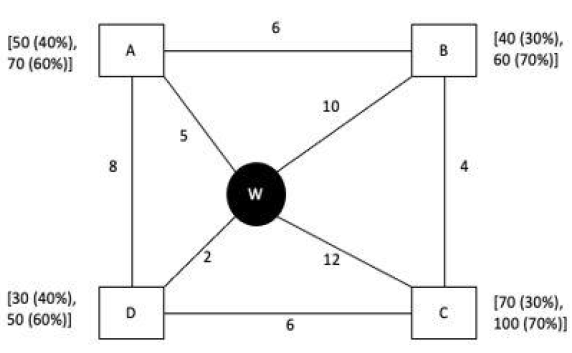
Every day the supplier gets the information about the demand values of the four locations and creates the travel route that starts from the warehouse and ends at a location after visiting all
the locations exactly once. While making the route plan, the supplier goes to the locations in decreasing order of demand. If there is a tie for the choice of the next location, the supplier will go to the location closest to the current location.
Also, while creating the route, the supplier can either follow the direct path (if available) from one location to another or can take the path via the warehouse. If both paths are available (direct and via warehouse), the supplier will choose
the path with minimum distance.
Question 16: If the last location visited is Ahmednagar, then what is the total distance covered in the route (in km)?
Watch the video solution
Question 17: If the total number of widgets delivered in a day is 250 units, then what is the total distance covered in the route (in km)?
Watch the video solution
Question 18: What is the chance that the total number of widgets delivered in a day is 260 units and the route ends at Bikrampore?
[a] 10.8%
[b] 17.64%
[c] 33.33%
[d] 7.56%
Watch the video solution
Question 19: If the first location visited from the warehouse is Ahmednagar, then what is the chance that the total distance covered in the route is 40 km?
[a] 30%
[b] 18%
[c] 5.4%
[d] 3.24%
Watch the video solution
Question 20: If Ahmednagar is not the first location to be visited in a route and the total route distance is 29 km, then which of the following is a possible number of widgets delivered on that day?
[a] 210
[b] 220
[c]
200
[d] 250
Watch the video solution